Course Category

Course categoryData Science & Business Analytics
4.7 / 5
Course Rating

AI Powered Data Analyst Course

  • 6 Months
  • 3.2K learners
AI Powered Data Analyst Course
$ 800.00
  • CategoryData Science & Business Analytics
  • Rated4.7 / 5
  • Learners3.2K
  • Duration6 Months
Show More
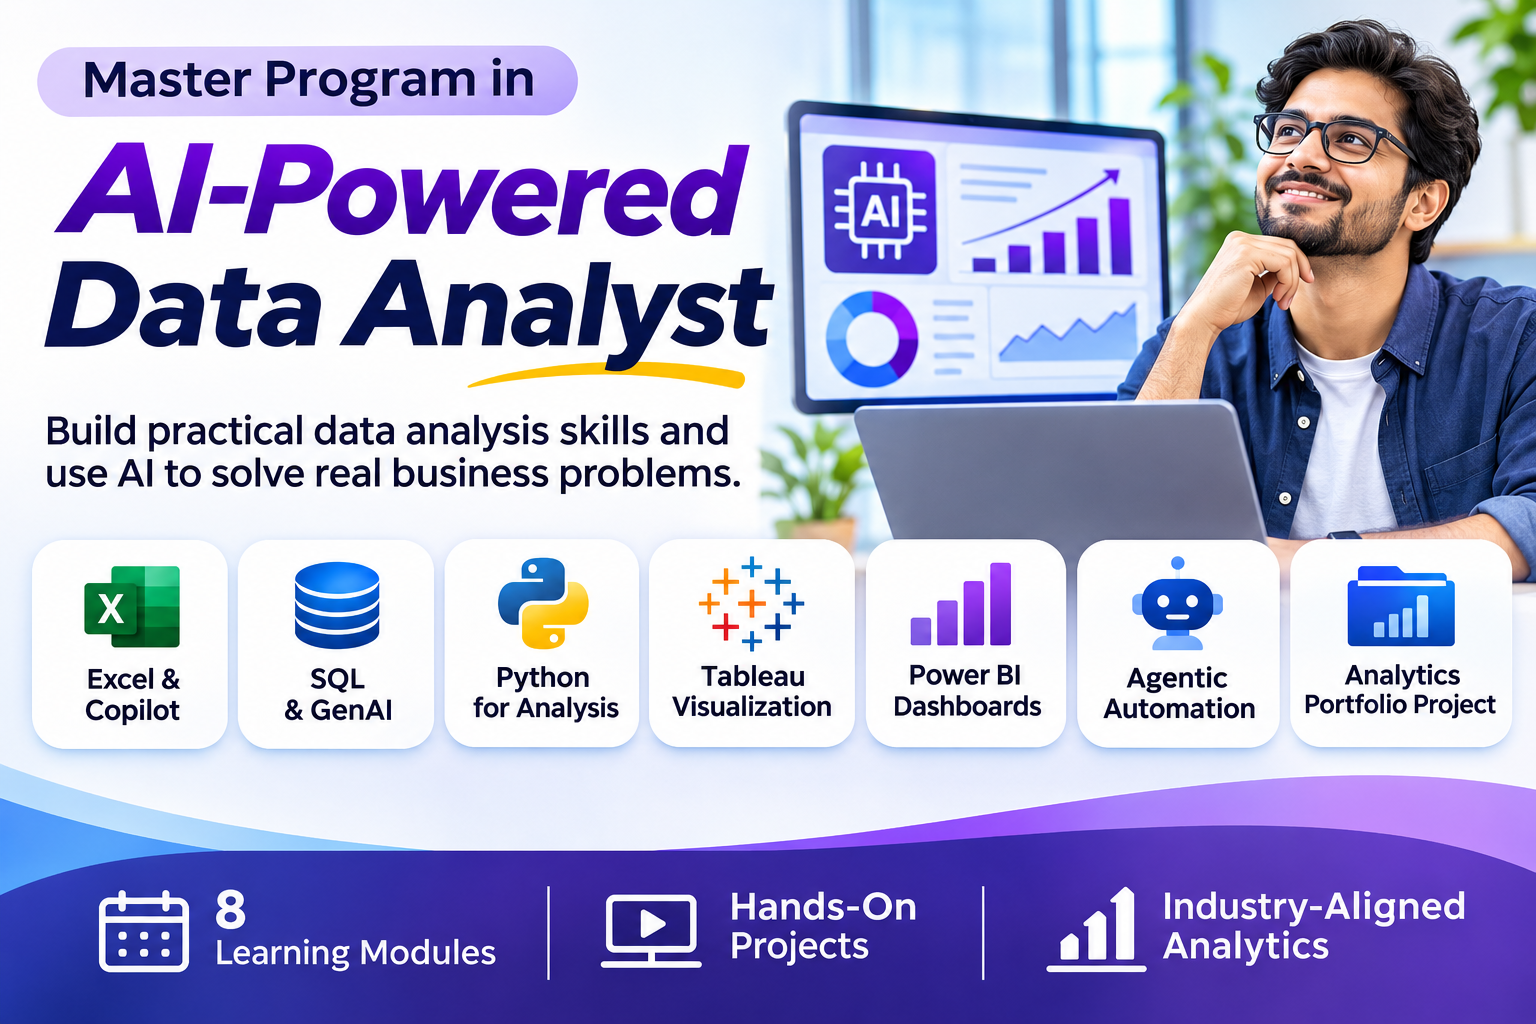
Build practical data analytics skills with statistics, SQL, Python, Excel, Tableau and AI-powered automation. Learn to analyze information, create meaningful dashboards and turn data into insights that support better business decisions.

What You'll Learn

Explore the complete data analytics workflow, from understanding datasets and building data pipelines to querying databases, analyzing information and communicating findings through visual reports. Discover how generative AI tools and automation can make everyday analytics tasks more efficient.
  • Apply descriptive statistics and statistical inference.
  • Understand data structures, pipelines and ETL processes.
  • Analyze spreadsheets using Excel and Copilot.
  • Write SQL queries with AI-assisted techniques.
  • Use Python, NumPy and pandas for data analysis.
  • Perform data cleaning and exploratory analysis.
  • Create visual reports and dashboards with Tableau.
  • Explore Power BI dashboard development.
  • Understand data storytelling and business reporting.
  • Use statistical methods to investigate business questions.
  • Explore AI-assisted analytics and prompt engineering.
  • Build automated workflows using tools such as n8n and Zapier.
  • Understand agentic automation for reporting and alerts.
  • Develop a data analytics portfolio through project work.

Tools and Technologies

Get familiar with tools used across the analytics ecosystem, including Excel, Copilot, SQL, Python, NumPy, pandas, Tableau, Power BI, Jupyter Notebook, MySQL Workbench, Seaborn, GitHub, n8n and Zapier. Understand how these technologies support data preparation, visualization, reporting and workflow automation.

Practical Project Applications

Explore analytics scenarios involving retail sales, e-commerce, airline operations, employee performance, marketing campaigns, customer behavior, sales intelligence and business dashboards. Apply data analysis concepts to practical problems and build a portfolio that demonstrates your understanding of the analytics lifecycle.
Show More

Program Overview

Follow a structured learning path covering statistics, data pipelines, AI-assisted analytics, SQL, Python, data visualization and workflow automation. The program also includes portfolio-based project work to connect analytical concepts with practical business scenarios.

Learning Path

Build a foundation in statistical thinking and learn how to summarize and interpret datasets. Explore descriptive statistics, data distribution, hypothesis testing and statistical methods such as Z-tests, T-tests and ANOVA to investigate business questions and compare results.

Understand how data moves through an analytics environment. Explore data sources, data preparation, transformation and pipeline concepts, including the role of ETL processes in organizing information for reliable analysis and reporting.

Explore spreadsheet analysis with Excel and AI assistance. Work with formulas, data summaries, PivotTables and charts while understanding how Copilot can help with data exploration, reporting and everyday analytical activities.

Learn how relational databases organize business information and how SQL helps retrieve and analyze it. Explore database queries and the use of generative AI assistance to support query writing, data retrieval and analytical problem-solving.

Develop Python-based data analysis skills using programming concepts and commonly used libraries. Explore NumPy and pandas for data manipulation, cleaning, transformation and exploratory data analysis, and understand how Python can help uncover useful patterns in datasets.

Learn to communicate analytical findings through visual storytelling. Explore charts, dashboards and data presentation techniques using Tableau. Understand how visual reports can reveal trends, compare performance and make complex information easier to interpret.

Discover how no-code and low-code automation platforms can simplify recurring analytics tasks. Explore tools such as n8n, Zapier, Make and Power Automate to understand automated reporting, alerts, workflow coordination and AI-assisted data processes.

Bring together the skills developed throughout the learning path in a portfolio-focused project. Explore how data can be prepared, analyzed and presented to solve business problems, communicate findings and demonstrate an end-to-end analytics workflow.

Additional Learning Courses

  • AI-Powered Dashboards with Power BI and PL-300 Certification Training.
  • Industry-Aligned Analytics: Manufacturing, Marketing and Finance Analytics.

Industry Project Areas

  • Retail sales performance and e-commerce dashboards.
  • Retail point-of-sale and customer order analysis.
  • Air cargo and airline operations analysis.
  • Employee performance and business reporting.
  • Marketing campaign and customer conversion analysis.
  • Sales intelligence and regional performance dashboards.
  • Restaurant data reporting and insurance metrics dashboards.
  • AI-powered lead management automation.

Who Should Take This Course

  • Beginners interested in starting a journey in data analytics.
  • Graduates exploring data-focused career opportunities.
  • Business professionals who work with reports and datasets.
  • Aspiring data analysts and business analysts.
  • Professionals looking to improve their technical analytics skills.
  • Learners interested in AI-assisted analysis and automation.

What You Will Learn

  • Statistical analysis and hypothesis testing.
  • Data preparation, pipelines and ETL workflows.
  • Excel analysis with AI assistance.
  • SQL querying and GenAI-assisted techniques.
  • Python programming for data analysis.
  • Data visualization and storytelling with Tableau.
  • Power BI dashboard concepts.
  • Agentic automation and analytics workflows.
  • Portfolio development through practical projects.


AI Powered Data Analyst Course

STAY CONNECTED WITH EDYLEARN

Subscribe To Our Newsletter

Get learning updates, new course announcements and useful insights delivered straight to your inbox.

Learn. Grow. Achieve.

00

Learn At Your Pace
Flexible Learning

00

Build Useful Skills
Practical Learning